
AMOC COLLAPSE: THE WARNING SIGNS
By Paul Harrison | Founder & Publisher, Orbis Weather
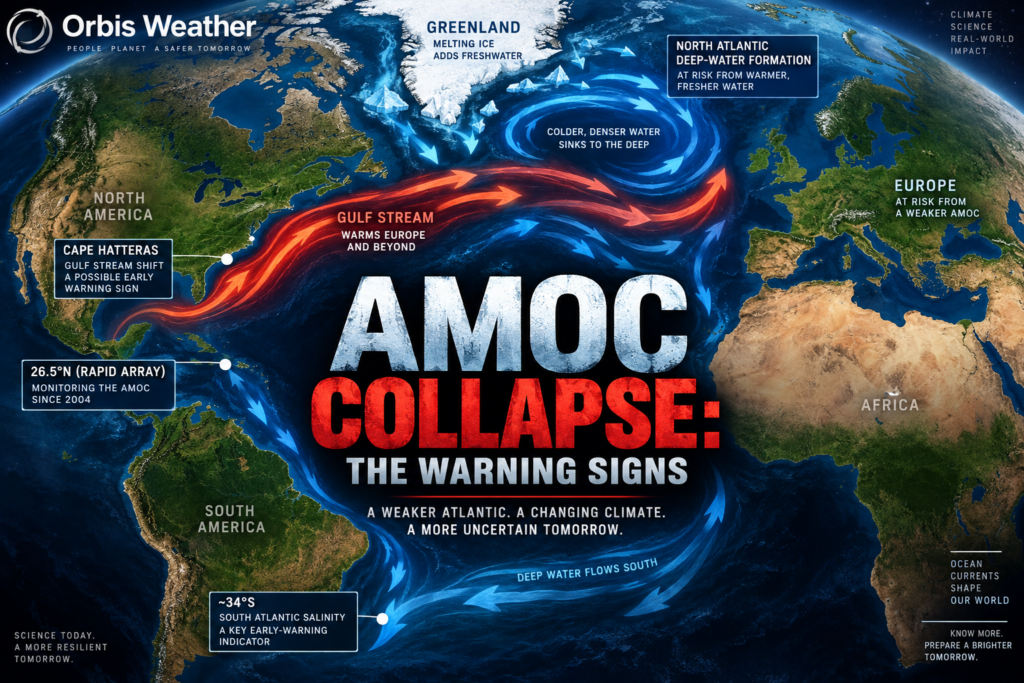

AMOC Collapse: How Will We Know When the Atlantic Is Approaching a Tipping Point?
· @Paul
By Paul Harrison, Orbis Weather
Scientists are getting better at identifying the warning signs, but there may not be a simple countdown before one of Earth’s most important ocean circulation systems undergoes a profound change.
The Atlantic Meridional Overturning Circulation, or AMOC, carries warm water north through the Atlantic and keeps northwest Europe several degrees milder than its latitude would suggest. Climate scientists agree it is very likely to weaken this century. They disagree about whether, and when, it could cross a threshold beyond which it shuts down for centuries.
The harder question is whether anyone would see that threshold coming. Researchers now watch for it in several ways: statistical tremors in ocean temperature records, the flow of fresh water at the southern edge of the Atlantic, a cold patch south of Greenland, and direct measurements from instruments strung across the ocean. Each has given cause for concern. None gives a date.
“We are never going to get a [fully] reliable ‘early warning’,” Stefan Rahmstorf of the Potsdam Institute for Climate Impact Research told Carbon Brief this year. A UK government research agency is nevertheless funding an attempt to build one, with a prototype due by 2030.
Key facts
| Detail | Source |
|---|---|---|
What it is | A system of Atlantic currents that moves warm surface water north and cold deep water south | Carbon Brief |
How strong | About 15 to 17 sverdrups in 2011 to 2020, down from 18 to 19 in 2004 to 2008. One sverdrup is a million cubic meters of water a second. | RAPID array, via Carbon Brief |
Heat carried | About 1.2 petawatts northward at 26.5°N | UK National Oceanography Centre |
Measured directly since | 2004 | RAPID array |
Measured trend | A decline of about 1 sverdrup a decade from 2004 to 2023, with a range of 0.4 to 1.6 | 2025 study in Geophysical Research Letters |
Expected this century | “Very likely” to decline: about 24% under low emissions and about 39% under very high emissions by 2100 | IPCC |
Chance of abrupt collapse before 2100 | The IPCC has “medium confidence” it will not happen | IPCC |
What “collapse” means | In climate models, a circulation that settles at roughly 3 to 6 sverdrups | Carbon Brief |
Range of published timing estimates | From the 2030s to well after 2100, or not at all | Studies from 2023 to 2026 |
When the record will be long enough | Around 2033, after about 29 years of data | 2020 study, via Carbon Brief |
Early-warning system | UK prototype targeted for 2030 | ARIA, via New Scientist |
What the AMOC is and why it matters
The AMOC is a conveyor of heat. Warm, salty water flows north near the surface of the Atlantic. In the seas around Greenland and Iceland it gives up its heat to the air, becomes cold and dense, sinks, and flows back south along the ocean floor.
Salt is what makes it work. Salty water is denser than fresh water, so it sinks more readily when it cools. Anything that freshens the far North Atlantic, such as more rain, melting sea ice or meltwater from Greenland, makes the surface water lighter and the sinking weaker.
That creates a feedback. A weaker circulation brings less salty water north, which makes the northern water fresher still, which weakens the circulation further. It is this self-reinforcing loop that gives the AMOC the potential to tip.
It is not the Gulf Stream
The two are often confused. The Gulf Stream is a wind-driven current along the U.S. East Coast. It is part of the route the AMOC’s warm water takes, but it would keep flowing in some form even if the overturning stopped.
It has shut down before
The geological record shows the circulation can change state. Studies of shells in sea-floor sediment found that far less surface water reached the deep ocean during the Younger Dryas, a cold period that began about 12,900 years ago and lasted about 1,300 years. The oceanographer Wallace Broecker warned in the journal Nature in 1987 that human-caused warming could disrupt it again. “We play Russian roulette with the climate,” he said.
What a tipping point means here
A tipping point is a threshold past which a system keeps changing on its own, even if the push that started it stops.
For the AMOC the idea goes back to 1961, when the oceanographer Henry Stommel showed with a simple model that the circulation could have two stable states, one strong and one weak. Push it far enough and it flips from the first to the second. Getting it to flip back is much harder than tipping it in the first place.
Three points are easy to miss.
- Weakening is not collapse. A gradual decline of a third or a half by 2100 is the mainstream expectation and would have serious effects of its own. Collapse means settling into the weak state, at roughly 3 to 6 sverdrups against about 17 today. Niklas Boers of the Potsdam Institute calls the exact definition a “matter of convention”.
- Tipping is not instant. The change scientists have in mind “happens over decades or maybe a century”, said Laura Jackson of the UK Met Office. The threshold could be crossed long before the circulation actually winds down.
- Crossing may be invisible. Because of that delay, the point of no return and the visible collapse are different moments. “We might be committed to centuries of change without knowing it,” Paul Holland of the British Antarctic Survey told New Scientist.
The warning signs scientists watch
There is no single gauge. Researchers look at five kinds of evidence, each with its own weakness.
Warning sign | What it is | What it has shown | Its weakness |
|---|---|---|---|
Statistical “slowing down” | A system near a tipping point recovers more slowly from disturbances, so its records wobble more and for longer | A 2021 study found “strong evidence” of an approach to a transition; a 2023 study used it to estimate collapse between 2037 and 2109 | Relies on sea surface temperature as a stand-in for the circulation, and on old, sparse data |
Freshwater flow at 34°S | Whether the circulation carries fresh water out of the Atlantic or into it at its southern boundary, a physical measure of how stable it is | A 2024 study concluded the AMOC is “on tipping course”; a 2025 follow-up put the possible onset of collapse as early as 2063 | Measured over a short period; depends on how well models represent salt |
The “cold blob” | A patch of ocean south of Greenland that has cooled over 150 years while almost all the rest of the surface warmed | Used to infer a slowdown of about 15% since 1950 | An indirect fingerprint that other processes can also produce |
Direct measurement | Instruments across the Atlantic that measure the flow itself | A decline of about 1 sverdrup a decade at 26.5°N since 2004, with no significant trend farther north | The record is only two decades long |
Freshwater sources | Meltwater from Greenland and Arctic sea ice entering the North Atlantic | About 200 Greenland fjords are discharging ice and meltwater roughly five times faster than 30 years ago | Hard to track where the water ends up |
The statistical signals
The mathematics of tipping points predicts a tell-tale sign. As a system loses stability it takes longer to settle after each disturbance, and its fluctuations grow. Scientists call this critical slowing down. A 2021 study in Nature Climate Changelooked for it in long records of Atlantic temperature and salinity and found what it described as strong evidence that the circulation is approaching such a transition. A 2023 study in Nature Communications went further and extrapolated a date range.
The physical signals
A group at Utrecht University in the Netherlands has argued for indicators grounded in ocean physics. Their 2024 paper in Science Advances tracked the transport of fresh water at the Atlantic’s southern boundary and concluded the circulation is on course to tip. A 2025 paper in the Journal of Geophysical Research: Oceans estimated that collapse could begin as early as 2063 under a medium-emissions pathway, and put the threshold near 2.5°C of global warming. A 2026 study pointed to abrupt shifts in the path of the Gulf Stream as another signal.
“The risk of reaching the tipping point… is too high to ignore,” René van Westen, one of the Utrecht authors, told New Scientist.
The meltwater
Much of the uncertainty lies in Greenland. Kelly Hogan of the British Antarctic Survey told New Scientist that about 200 fjords there are now releasing icebergs and meltwater about five times faster than three decades ago. Her colleague Pierre Dutrieux described the retreat of fjord glaciers as “an unstable, self-sustaining process”, which makes it hard to model. Icebergs also drift thousands of kilometers before they melt, so the fresh water does not enter the ocean where it left the land.
How the AMOC is measured today
Direct measurement began only in 2004, which is the root of much of the disagreement.
RAPID, at 26.5°N
A line of moored instruments runs across the Atlantic from Florida to the Canary Islands. It has measured the overturning continuously since 2004. “RAPID was designed specifically to be close to the maximum of that heat transport,” said Ben Moat of the UK National Oceanography Centre.
- The average strength was 18 to 19 sverdrups in 2004 to 2008 and 15 to 17 in 2011 to 2020.
- A 2025 study put the decline over 2004 to 2023 at about 1 sverdrup a decade, similar to the pace climate models project for the rest of the century.
- Much of that fall came as a step around 2008 to 2009, not as a steady slide, according to a 2026 analysis.
The subpolar arrays
Farther north, the OSNAP array has measured the overturning between Canada, Greenland and Scotland since 2014. A study published in May 2026 in the journal Ocean Science combined OSNAP with ship and float data to extend that northern record back to 2004. It found no statistically significant trend over 20 years, while confirming the decline at RAPID over the same period.
So the two best direct records do not yet tell the same story.
Why 20 years is not enough
The circulation swings naturally from year to year and decade to decade. A 2023 review of the RAPID data said the record was “still too short” to separate a climate-driven trend from those swings. An earlier study estimated that about 29 years would be needed, a mark the array reaches around 2033.
Reaching back before 2004
For earlier decades scientists rely on indirect evidence. A reconstruction posted as a preprint in March 2026, built from ocean temperature and salinity observations, estimated a weakening of 16% to 23% since the mid-20th century across the whole Atlantic. It has not yet been peer reviewed. The IPCC, in its last assessment, had low confidence in estimates of 20th-century weakening.
What recent studies say, and why they disagree
Published estimates range from a collapse beginning within a few decades to no collapse this century at all.
Study | Method | Finding |
|---|---|---|
Nature Communications, 2023 | Statistical warning signals in North Atlantic surface temperatures | Collapse between 2037 and 2109, most likely mid-century |
Science Advances, 2024 | Freshwater transport at the Atlantic’s southern boundary | The AMOC is “on tipping course”; no date given |
Nature, 2025 | 34 climate models under extreme forcing | Collapse below 6 sverdrups “unlikely” this century |
Nature Geoscience, 2025 | Models constrained by physics | Weakening of 18% to 43% by 2100, even under very high emissions |
Environmental Research Letters, 2025 | Model runs extended beyond 2100 | Shutdown after 2100 in 67% of very-high-emission runs, 30% of medium and 25% of low |
JGR Oceans, 2025 | Physics-based indicators in models | Collapse could begin as early as 2063 under medium emissions; threshold near 2.5°C |
Science Advances, 2026 | Model projections corrected against observations | A slowdown of about 51% by 2100 under medium emissions, against 32% uncorrected |
Preprint, June 2026 | Large ensembles of model simulations | A 10% to 23% chance that collapse is already committed; not yet peer reviewed |
Summaries from Carbon Brief, Yale Environment 360 and ArcticToday.
Why the answers differ
- They measure different things. Some look for statistical signals in temperature records. Others run climate models forward. The two approaches have different blind spots.
- They define collapse differently. A study can find a 50% weakening and still conclude there was no collapse.
- They stop at different dates. “The most interesting AMOC dynamics happen after 2100, but most [climate model] simulations are terminated at 2100,” van Westen said.
- The models may be too stable. Many climate models are too fresh in the South Atlantic, a bias that can make the simulated circulation harder to tip than the real one. Correcting for it was the main reason the 2026 Science Advances study projected a larger slowdown.
The official assessment
The IPCC’s 2021 report said the AMOC will “very likely decline” this century under every scenario, and that it had “medium confidence” there would be no abrupt collapse before 2100. It had low confidence in the numbers. Most of the studies above were published after that report.
Why there may be no simple countdown
The warning signs can show that risk is rising. They cannot, so far, be turned into a date. Scientists give five reasons.
1. The records are too short and too indirect. Twenty-two years of direct measurement cannot yet separate a trend from natural swings. Longer records use surface temperature as a stand-in for a current that runs kilometers deep. Rahmstorf says the data are simply too limited for a fully reliable warning.
2. Statistical signals indicate direction, not timing. Niklas Boers, whose 2021 study found evidence of an approaching transition, is blunt about what that evidence can do: “So, early warning in terms of a prediction? No way. It just doesn’t work.”
3. The threshold itself may be blurred. An AMOC collapse has never been observed with instruments. “It may be that there is a very definite threshold in the system,” Jon Robson of the University of Reading told New Scientist, but it is also possible that there is not one sharp line. A sudden shock, such as a pulse of fresh water from Arctic sea ice, could also bring a transition forward.
4. The point of no return and the collapse are decades apart. The circulation responds slowly. A June 2026 preprint led by Philip Holden of the Open University estimated a 10% to 23% chance that collapse is already committed, depending on how much meltwater Greenland releases. “There is a significant probability that we’re already committed to collapse, and we can’t change that even now,” he told New Scientist. That study has not been peer reviewed.
5. The biggest driver is the hardest to forecast. How fast Greenland’s glaciers will shed ice, and where that fresh water will go, is poorly constrained.
What a warning system could still do
The UK’s Advanced Research and Invention Agency, ARIA, is funding an attempt to build an early-warning system for climate tipping points, with a prototype planned for 2030. As described to New Scientist, it would not give a date. It would publish a monthly risk level on a five-step scale, from no elevated threat to a tipping point crossed, alongside forecasts of what adaptation would then be needed.
The program includes new measurements at the source. The research ship Sir David Attenborough is carrying instruments, an autonomous submarine and an uncrewed surface vessel to Greenland’s fjords to measure meltwater and iceberg calving directly.
The model is closer to a storm watch than a countdown clock: a statement that conditions are becoming dangerous, issued without knowing exactly when or whether the event will arrive.
What a collapse or sharp weakening would do
The effects would reach far beyond the North Atlantic. “You’re getting a whole-system shock,” van Westen said.
Region | Projected effect of a collapse | Source |
|---|---|---|
Northern Europe | Temperatures 5 to 15°C (9 to 27°F) lower | Science Advances study, via Yale Environment 360 |
London and Oslo | Winter cold extremes near −20°C and −48°C, even with global warming continuing | 2025 study in Geophysical Research Letters |
Southern Europe | More drought | 2025 study in Hydrology and Earth System Sciences |
North Atlantic | A stronger storm track and more frequent winter storms | New Scientist |
West Africa and India | Monsoon rainfall down by almost 30% and 20% | New Scientist |
The tropics | The tropical rain belt shifts south | IPCC |
U.S. East Coast | Faster sea level rise; a 30% dip in the circulation in 2009 to 2010 was linked to a 128 mm (5 inch) jump north of New York City | 2015 study in Nature |
United Kingdom | Land suitable for arable farming falls from 32% to 7% | 2020 study in Nature Food |
Global | An extra 47 to 83 parts per million of carbon dioxide in the air, adding about 0.2°C of warming | 2026 study, via Carbon Brief |
European summers would stay nearly as hot as today, so the continent would face colder winters and hot, dry summers together. “The winter is like being in the ice age,” Tim Lenton of the University of Exeter said of Scotland in such a scenario.
The IPCC’s wording is that a collapse “would very likely cause abrupt shifts in the regional weather patterns and water cycle”.
A weakening short of collapse would produce smaller versions of the same effects. The 2026 Science Advances study notes that every sverdrup lost by 2100 removes about 0.05 petawatts of northward heat transport.
What is known, what is uncertain, and what to watch
Known
- The AMOC can exist in a strong state and a weak one, and has switched in the past.
- It is very likely to weaken this century.
- Direct measurements at 26.5°N show a decline since 2004.
- A collapse would be severe and, on human timescales, irreversible.
Uncertain
- Whether the measured decline is a climate trend or natural variability.
- How close the circulation is to a threshold, and whether that threshold is sharp.
- Whether climate models are too stable.
- How much fresh water Greenland will add, and how fast.
- Whether the threshold has already been crossed.
What to watch
- Around 2033: the RAPID record becomes long enough, by one estimate, to distinguish a forced trend from natural swings.
- By 2030: ARIA’s prototype early-warning system.
- The northern arrays: whether the subpolar record begins to show the decline seen farther south.
- Peer review of the June 2026 “already committed” study and the March 2026 reconstruction.
- Governments: Iceland designated a possible AMOC shutdown a national security threat in November 2025. In April 2026 its Climate Council urged faster emission cuts, citing projections of roughly 50% weakening by the end of the century.
- The next IPCC assessment, which will weigh the studies published since 2021.
What can be done
The risk rises with warming. The 2025 Utrecht study placed the threshold near 2.5°C, and model runs show shutdowns becoming far more common at high emissions. “Let’s do everything in our power to get to net-zero as quickly as possible,” Lenton said.
About this article
This article is an explainer on how scientists look for warning of an AMOC tipping point. It draws on Carbon Brief’s review of the research published in April 2026, on New Scientist’s reporting from September 2026, on a 2026 paper in Ocean Science, and on summaries of other recent studies. It was written on October 9, 2026.
Terms used
Term | Meaning |
|---|---|
AMOC | The Atlantic Meridional Overturning Circulation: the north-south circulation of the Atlantic, with warm water moving north near the surface and cold water returning south at depth. |
Sverdrup | The unit of ocean flow. One sverdrup is one million cubic meters of water a second, roughly five times the flow of the Amazon River. |
Petawatt | A million billion watts. |
Tipping point | A threshold beyond which a system shifts to a new state on its own and does not easily return. |
Bistability | Having two stable states under the same conditions. |
Critical slowing down | The tendency of a system near a tipping point to recover more slowly from disturbances. |
Deep convection | The sinking of cold, dense surface water to the deep ocean. |
Cold blob | The patch of the North Atlantic south of Greenland that has cooled while the rest of the ocean surface warmed. |
RAPID and OSNAP | The two main arrays of instruments that measure the overturning, at 26.5°N and in the subpolar North Atlantic. |
Preprint | A study made public before independent experts have reviewed it. |
Emissions pathway | A scenario for future greenhouse gas emissions. “Medium” here refers to the scenario scientists label SSP2-4.5. |
Notes on the evidence
- Two studies cited here are preprints and may change: the June 2026 estimate that collapse may already be committed, and the March 2026 reconstruction of weakening since 1960.
- Dates are onsets, not endpoints. A study that says collapse “could begin” in a given decade is describing the start of a process that takes decades more.
- Percentages of weakening use different baselines. Some compare with 1850 to 1900 and others with recent decades.
- Impact figures come from model experiments in which the circulation is made to collapse. They show what is possible, not what is forecast.
Limits
- Most studies are described here from summaries by Carbon Brief and other outlets. The original papers were not all reviewed directly.
- The science is moving quickly. Several findings are less than a year old and have not yet been tested by other groups.
- This article does not assign a probability to collapse. The published estimates are too far apart to combine.
Frequently asked questions
What is the AMOC?
It is the system of Atlantic currents that carries warm surface water north and returns cold water south at depth. It moves heat toward Europe and affects rainfall patterns around the world.
Is the AMOC collapsing now?
No collapse has been observed. Measurements show it has weakened at one latitude since 2004, and most scientists expect it to weaken further this century. Whether it is close to a tipping point is disputed.
When could it collapse?
Published estimates range from the 2030s to after 2100, and some studies find no collapse this century. The IPCC has medium confidence that an abrupt collapse will not happen before 2100.
How would we know it was about to happen?
Scientists watch for statistical changes in ocean records, shifts in freshwater flow in the South Atlantic, the cold patch south of Greenland and direct measurements of the current. These can show rising risk. Leading researchers say they cannot give a reliable date.
Could the tipping point already have been passed?
Possibly. One 2026 study, not yet peer reviewed, put the chance at 10% to 23%. Because the circulation responds slowly, a threshold could be crossed decades before the effects are obvious.
Is the AMOC the same as the Gulf Stream?
No. The Gulf Stream is a wind-driven current off the U.S. East Coast and is one part of the system. It would not stop if the overturning collapsed.
Would Europe freeze?
Northern Europe would become much colder in winter, by 5 to 15°C in one study. Summers would stay hot. The Hollywood version of an overnight ice age is not what the science describes.
How would it affect the United States?
The main effects would be faster sea level rise on the East Coast and changes in storm tracks and rainfall.
Can a collapse be prevented?
The risk rises with global temperature, so limiting warming lowers it. One study put the threshold near 2.5°C of warming.
Has it happened before?
Yes. The circulation weakened sharply about 12,900 years ago, during a cold period called the Younger Dryas that lasted about 1,300 years.
Sources
- Carbon Brief: AMOC: Is global warming tipping key Atlantic ocean currents towards “collapse”?, April 24, 2026
- New Scientist, as reposted by GeoGarage: The collapse of the AMOC would be catastrophic. How will we know when it’s coming?, September 28, 2026
- Ocean Science: The Scotland–Canada overturning array (SCOTIA): twenty years of meridional overturning in the subpolar North Atlantic, May 8, 2026
- Yale Environment 360: Collapse of Atlantic currents may already be “locked in”, July 7, 2026
- ArcticToday: AMOC collapse may already be locked in, new study suggests, July 8, 2026
- Ocean to Climate: observational constraints project a 50% AMOC weakening, April 16, 2026, on Portmann and colleagues in Science Advances
- Ocean to Climate: a reconstruction of the AMOC since 1960, March 13, 2026, on a preprint by Li and colleagues
- Annual Review of Marine Science: The probability of an AMOC collapse onset in the twenty-first century, Dijkstra and van Westen, 2026
Orbis Weather compiled this article from the public sources above.
About the Author
Paul Harrison — Founder & Publisher, Orbis Weather
Paul Harrison founded Orbis Weather in 2026 to make global weather and natural-hazard information easier to find, follow and understand. His coverage includes tropical cyclones, severe weather, extreme temperatures, earthquakes, volcanoes, wildfires, flooding and significant natural disasters worldwide.
View all articles by Paul Harrison → | Editorial Standards →