
100 Years of Rising Seas: The Ocean Has Been Quietly Climbing for a Century
By Paul Harrison | Founder & Publisher, Orbis Weather

100 Years of Rising Seas: The Ocean Has Been Quietly Climbing for a Century
· @Paul
By Paul Harrison, Orbis Weather
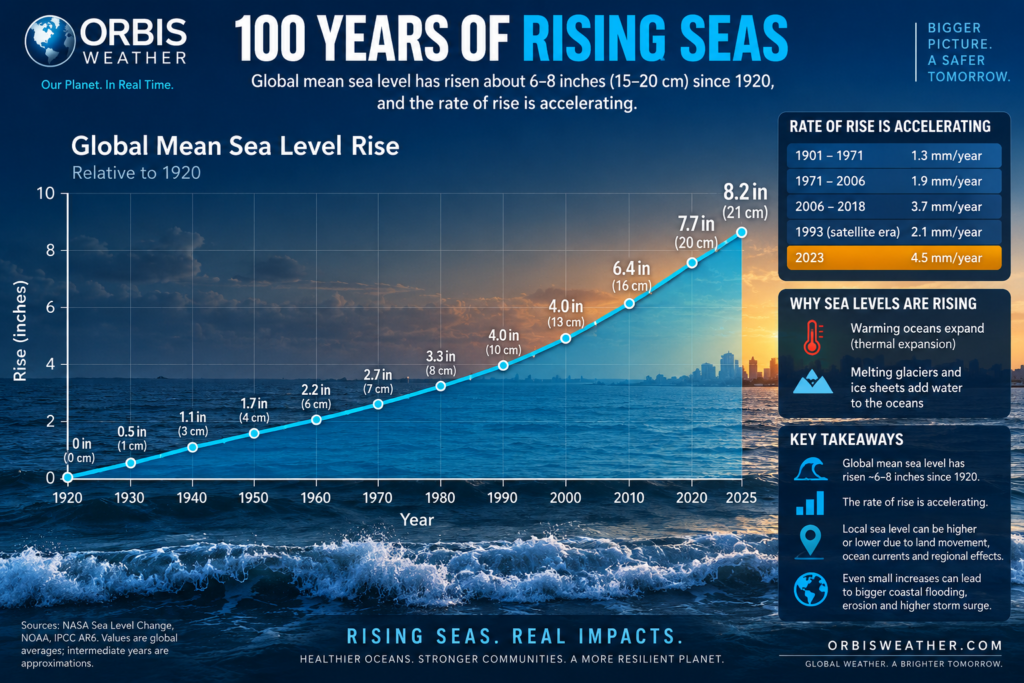
The world’s oceans stand 15 to 20 centimeters (6 to 8 inches) higher than they did a century ago, according to tide gauge records compiled by NASA. Along the coast of the contiguous United States the rise has been greater still, about 25 to 30 centimeters (10 to 12 inches).
The change has been too slow to see from a beach, which is why it is easy to miss. But it has not been steady. The sea rose at about 1.3 millimeters a year in the first two thirds of the 20th century. It is now rising at about 4.4 millimeters a year, more than three times as fast, and NASA says the rate has more than doubled in the three decades that satellites have been watching.
The United Nations’ climate science panel has concluded that sea level has risen faster since 1900 than in any century in at least 3,000 years. The causes are well understood: seawater expands as it warms, and glaciers and ice sheets are melting into it. What is less certain is how fast the next century’s rise will be.
Key facts
| Detail | Source | |
|---|---|---|
| Global rise in the past 100 years | 15 to 20 cm (6 to 8 inches) since 1920 | NASA, from tide gauges |
| Global rise, 1901 to 2018 | 20 cm (about 8 inches), with a range of 15 to 25 cm | IPCC |
| Global rise since 1880 | 21 to 24 cm (8 to 9 inches) | NOAA |
| Rise since satellites began, 1993 | About 10 cm (4 inches) | NASA |
| Rate, 1901 to 1971 | 1.3 mm a year | IPCC |
| Rate now | About 4.4 mm (0.17 inches) a year | NASA |
| U.S. coast, past 100 years | 25 to 30 cm (10 to 12 inches) | NASA |
| Main causes | Warming seawater expanding; glaciers and ice sheets melting | IPCC |
| Historical context | Fastest rise of any century in at least 3,000 years | IPCC |
| Expected by 2100 | Roughly 0.3 to 1 m (1 to 3.3 feet) more, depending on emissions | IPCC |
| Expected on U.S. coasts by 2050 | 25 to 30 cm (10 to 12 inches) more than in 2020 | NOAA |
A century in numbers
The sea has risen by about the length of a hand in 100 years, and roughly half of that has come in the last 30.
The rise has sped up
The Intergovernmental Panel on Climate Change (IPCC) divided the record into three periods in its most recent assessment. NASA’s satellite record brings it up to date.
| Period | Average rate of global sea level rise | Source |
|---|---|---|
| 1901 to 1971 | 1.3 mm a year (0.05 inches) | IPCC |
| 1971 to 2006 | 1.9 mm a year (0.07 inches) | IPCC |
| 2006 to 2018 | 3.7 mm a year (0.15 inches) | IPCC |
| Current rate | 4.4 mm a year (0.17 inches) | NASA |
When satellite measurements began in 1993, the rate was about 2.0 mm a year. It has more than doubled since. The World Meteorological Organization reported the same pattern in 2023, putting the average for 2013 to 2022 at 4.62 mm a year, more than twice the rate of the first decade of satellite data.
What the difference adds up to
A few millimeters a year sounds trivial. Over a century it is not.
- At the early 20th-century rate of 1.3 mm a year, a century brings 13 cm (5 inches).
- At today’s 4.4 mm a year, a century would bring 44 cm (17 inches), even with no further acceleration.
Those are simple multiplications, not forecasts. They show why scientists pay as much attention to the rate as to the total.
The last two years
The rise is not smooth from year to year.
- 2024: global sea level rose 0.59 cm (0.23 inches), well above the expected 0.44 cm.
- 2025: it rose only 0.08 cm (0.03 inches). A mild La Niña brought heavy rain to the Amazon basin, which temporarily moved water from the ocean onto land, NASA said in January.
“The weather gives us a wild ride, and what we saw with sea level rise last year is part of that ride,” said Josh Willis, a sea level researcher at NASA’s Jet Propulsion Laboratory. “But that cycle is short-lived. The extra water in the Amazon is going to reach the oceans in less than a year.”
A long view
Geological evidence from salt marshes, corals and sediments lets scientists reconstruct sea level long before instruments. On that evidence the IPCC concluded, with high confidence, that “global mean sea level has risen faster since 1900 than over any preceding century in at least the last 3000 years”.
How sea level is measured
Two independent systems track the height of the sea, and they agree.
Tide gauges: the long record
A tide gauge measures the height of the water against a fixed point on land, usually in a harbor. Some stations have run for more than a century, which is how scientists know what the sea was doing in the 1920s.
Tide gauges have two limits. They sit on coasts, so they say little about the open ocean. And they measure the sea relative to the land they stand on, so a gauge on sinking ground shows a faster rise than one on stable rock.
Satellites: the global record
Since 1993, radar instruments in orbit have measured the height of the sea surface across the open ocean.
| Mission | Role |
|---|---|
| TOPEX/Poseidon | Began the continuous record in the early 1990s |
| Jason-1, Jason-2, Jason-3 | Carried it forward; Jason-3 is still in orbit |
| Sentinel-6 Michael Freilich | The reference satellite since 2022; maps about 90% of the world’s oceans every 10 days |
| Sentinel-6B | Launched in November 2025 and due to take over as the reference satellite |
Each new satellite flies in formation with its predecessor for a time, so their measurements can be matched precisely.
Finding out why
Other instruments explain where the extra water and extra volume come from.
- Argo floats. Thousands of drifting robots dive and surface across the oceans, measuring temperature. They show how much the water has expanded.
- Gravity satellites. The GRACE Follow-On mission detects tiny changes in Earth’s gravity as ice sheets lose mass and water moves between land and sea.
- Field surveys. Glaciologists measure glaciers directly.
Why the sea is rising
There are two main reasons, and both come from a warming planet: the water is expanding, and there is more of it.
Warmer water takes up more room
The ocean has absorbed most of the extra heat trapped by greenhouse gases. Water expands as it warms. Spread through an ocean several kilometers deep, a small expansion raises the surface measurably. Scientists call this thermal expansion.
Ice on land is melting into the sea
- Mountain glaciers are shrinking on every continent that has them.
- The Greenland Ice Sheet lost about 34 billion tons of ice a year from 1992 to 2001. From 2012 to 2016 it lost about 247 billion tons a year.
- The Antarctic Ice Sheet went from losing about 51 billion tons a year to about 199 billion tons a year over the same periods.
Floating sea ice, such as the Arctic pack, does not raise sea level when it melts, because it is already displacing its own weight of water.
The balance has shifted
| Source | Share of the rise, 1971 to 2018 | Share in recent decades |
|---|---|---|
| Thermal expansion | 50% | About 30% |
| Glaciers and ice sheets | 42% (glaciers 22%, ice sheets 20%) | About 60% |
| Water moved from land to sea | 8% | About 10% |
Left column from the IPCC. Right column from the European Union’s Copernicus Climate Change Service, for the period since 1999.
Melting ice has overtaken warming water as the larger cause. That matters for the future, because the ice sheets hold far more potential sea level rise than expansion can deliver, and they respond slowly.
A small human contribution from the land
Pumping groundwater for farms and cities moves water that was stored underground into rivers and eventually the sea. It is a minor factor globally, but it is also one of the reasons some coasts are sinking.
Why the rise is not the same everywhere
The global average is a useful number, but nobody lives at the global average. Local sea level depends on what the land and the ocean nearby are doing.
Land that rises or sinks
- Sinking. Along the western Gulf Coast, the ground is settling as sediments compact and as groundwater, oil and gas are pumped out. Sea level there is rising faster than anywhere else in the country.
- Rising. In Alaska and a few places in the Pacific Northwest, the land is rising faster than the sea, so local sea level is falling.
Currents, winds and warmth
The ocean surface is not flat. Changes in currents and winds pile water up in some regions and draw it down in others. Regional trends can differ from the global one by as much as 5 mm a year in either direction, according to Copernicus. Some ocean basins have risen 15 to 20 cm since 1993 alone.
The United States
| Place | Change over about a century | Source |
|---|---|---|
| Global average | 15 to 20 cm (6 to 8 inches) | NASA |
| Contiguous U.S. coast, average | 25 to 30 cm (10 to 12 inches) | NASA |
| Boston, Massachusetts | About 30 cm (1 foot) | NOAA |
| Portland, Maine | About 20 cm (0.65 feet) | NOAA |
A dispute over acceleration
A U.S. Department of Energy report in July 2025 said American tide gauges “in aggregate show no obvious acceleration in sea level rise beyond the historical average rate”. More than 85 scientists issued a rebuttal to the report.
In December 2025, Christopher Piecuch of the Woods Hole Oceanographic Institution published an analysis of all 70 long-term tide gauge records in the contiguous United States. It found that the average rate of rise on U.S. coasts was under 2 mm a year in 1900 and over 4 mm a year in 2024.
“You can’t really just look at a record here and a record there, and expect to have representative results for the entire U.S.,” Piecuch told the Boston public radio station WBUR. One of the report’s authors, Judith Curry, questioned some of his methods.
What a higher sea already means
A rise of 20 or 30 centimeters does not drown a coastline. It changes how often the water reaches places it used to reach only in storms.
Flooding on sunny days
High-tide flooding, sometimes called nuisance or sunny-day flooding, happens when an ordinary high tide spills into streets and storm drains with no storm involved.
- It is now 300% to more than 900% more frequent on U.S. coasts than it was 50 years ago, NOAA says.
- The typical U.S. coastal community has five more flood days a year than in 2000, an increase of nearly 200%.
- In the 2023 to 2024 season, 34 U.S. tide stations tied or broke their records for flood days.
- NOAA projects a national average of 45 to 85 high-tide flood days a year by 2050.
Higher storm surge
Every storm now starts from a higher base. A surge that would once have stopped short of a road or a row of houses reaches a little farther. The effect is largest on flat coasts, where a small rise in height covers a wide strip of land.
Slower changes
- Erosion. Beaches and marshes retreat as the water line moves inland.
- Salt in fresh water. Seawater pushes into coastal aquifers and up river mouths, affecting drinking water and farmland.
- Drainage. Storm drains that empty into the sea work less well when the outlet is under water at high tide.
Who is exposed
About 130 million Americans, roughly 40% of the population, live in coastal counties, according to Piecuch. Worldwide, low-lying river deltas and small island nations face the greatest risk, because a small rise there affects a large share of their land.
What comes next
The sea will keep rising through this century under every scenario. How much depends mainly on how much more the planet warms.
The next 25 years
Much of the rise to 2050 is already set in motion by warming that has happened. For the United States, NOAA projects 25 to 30 cm (10 to 12 inches) of rise between 2020 and 2050. That is about as much in 30 years as in the previous 100. On the western Gulf Coast the figure is 40 to 45 cm (16 to 18 inches).
To the end of the century
The IPCC’s projections for global sea level in 2100, compared with the average for 1995 to 2014:
| Emissions pathway | Likely rise by 2100 |
|---|---|
| Very low | 0.28 to 0.55 m (0.9 to 1.8 feet) |
| Low | 0.32 to 0.62 m (1.0 to 2.0 feet) |
| Intermediate | 0.44 to 0.76 m (1.4 to 2.5 feet) |
| Very high | 0.63 to 1.01 m (2.1 to 3.3 feet) |
The panel adds a caution. Under very high emissions, a rise approaching 2 meters (6.6 feet) by 2100 and 5 meters by 2150 “cannot be ruled out due to deep uncertainty in ice-sheet processes”. It rates that outcome as low in likelihood.
Beyond 2100
Sea level responds slowly, so the rise continues for centuries after temperatures stop climbing. Over the next 2,000 years the IPCC estimates 2 to 3 meters of rise if warming is held to 1.5°C and 2 to 6 meters at 2°C.
The near term
A strong El Niño is under way in the Pacific. El Niño years tend to raise global sea level temporarily, the reverse of the La Niña effect that held it down in 2025. NASA expects rapid rise to resume as the water held on land returns to the ocean.
What is uncertain
The past century’s rise is well measured. The uncertainties are about the future and about particular places.
- The ice sheets. How quickly parts of Antarctica and Greenland could lose ice is the largest unknown, and the reason the upper end of the projections is so wide.
- Future emissions. The difference between the lowest and highest pathways is roughly 40 cm by 2100, comparing the middle of each range.
- Local rates. Land movement, currents and groundwater use make each coast different. Global figures should not be applied to a single town.
- Year-to-year swings. El Niño and La Niña can add or subtract several millimeters in a year, which is why trends are judged over decades.
- The early record. Before satellites, global estimates rest on a limited number of tide gauges, mostly in the Northern Hemisphere. That is why the century totals are given as ranges.
About this article
This article is an explainer on the long-term record of global sea level. It draws on NASA, the U.S. National Oceanic and Atmospheric Administration (NOAA), the Intergovernmental Panel on Climate Change (IPCC) and the European Union’s Copernicus Climate Change Service. It was written on October 9, 2026.
Terms used
| Term | Meaning |
|---|---|
| Global mean sea level | The average height of the whole ocean surface. |
| Relative sea level | The height of the sea measured against the local land. It includes any rising or sinking of the land. |
| Thermal expansion | The increase in the volume of water as it warms. |
| Ice sheet | A mass of land ice larger than 50,000 square kilometers. There are two, in Greenland and Antarctica. |
| Tide gauge | An instrument on the coast that records the height of the water. |
| Satellite altimeter | A radar that measures the height of the sea surface from orbit. |
| High-tide flooding | Flooding caused by a high tide alone, without a storm. |
| Storm surge | Water pushed ashore by a storm’s winds, on top of the tide. |
| Subsidence | The sinking of land, from natural settling or from pumping out water, oil or gas. |
| Emissions pathway | A scenario for how much greenhouse gas the world releases in future. |
Notes on the figures
- Why the century totals differ. NASA gives 15 to 20 cm since 1920. The IPCC gives 20 cm from 1901 to 2018. NOAA gives 21 to 24 cm since 1880. They cover different periods and all are consistent.
- Why the current rate differs between agencies. NASA gives about 4.4 mm a year from the full satellite record with acceleration. Copernicus gives 3.8 mm a year for 2015 to 2025 using a different method and baseline.
- Projections are measured from different starting years. The IPCC uses 1995 to 2014. NOAA’s U.S. figures use 2000 or 2020.
- Units. One inch is 2.54 centimeters. One meter is about 3.3 feet.
Limits
- The NOAA sea level page used here was last updated in 2023 and is now archived. Its long-term figures remain valid, but its “latest year” figures are not used.
- U.S. examples are used because the data are detailed. The same processes apply on every coast.
- This is a summary of published assessments, not new analysis.
Frequently asked questions
How much has sea level risen in the last 100 years?
About 15 to 20 cm (6 to 8 inches) worldwide since 1920, according to NASA. On the coast of the contiguous United States the average is 25 to 30 cm (10 to 12 inches).
Is sea level rise speeding up?
Yes. The rate was about 1.3 mm a year in the early and mid 20th century. It is about 4.4 mm a year now, and it has more than doubled since satellite measurements began in 1993.
What causes sea level to rise?
Two things: seawater expands as it warms, and melting glaciers and ice sheets add water to the ocean. Melting ice is now the larger of the two.
Does melting Arctic sea ice raise sea level?
No. Floating ice already displaces its own weight of water. Only ice on land, such as glaciers and the Greenland and Antarctic ice sheets, raises sea level when it melts.
Why is the rise different in different places?
Land can be sinking or rising, and currents and winds move water around. The western Gulf Coast of the United States has some of the fastest rise because the land is sinking. In parts of Alaska the land is rising and local sea level is falling.
How much will the sea rise by 2100?
The IPCC’s likely range is about 0.3 to 1 meter (1 to 3.3 feet) above the 1995 to 2014 level, depending on emissions. A higher rise cannot be ruled out if the ice sheets respond faster than expected.
Why did sea level barely rise in 2025?
A La Niña moved extra rain onto land, mainly the Amazon basin, which briefly took water out of the ocean. NASA expects that water to return within a year.
How do scientists know what sea level was 100 years ago?
From tide gauges in harbors, some of which have recorded the water height continuously for more than a century.
Can sea level rise be stopped?
Not quickly. The ocean and ice sheets respond slowly, so some further rise is certain. Cutting emissions reduces how much and how fast.
Will my town flood?
That depends on local land height, land movement and defenses. In the United States, NOAA’s tide gauge trends and high-tide flooding outlooks give figures for individual places.
About the Author
Paul Harrison — Founder & Publisher, Orbis Weather
Paul Harrison founded Orbis Weather in 2026 to make global weather and natural-hazard information easier to find, follow and understand. His coverage includes tropical cyclones, severe weather, extreme temperatures, earthquakes, volcanoes, wildfires, flooding and significant natural disasters worldwide.
View all articles by Paul Harrison → | Editorial Standards →