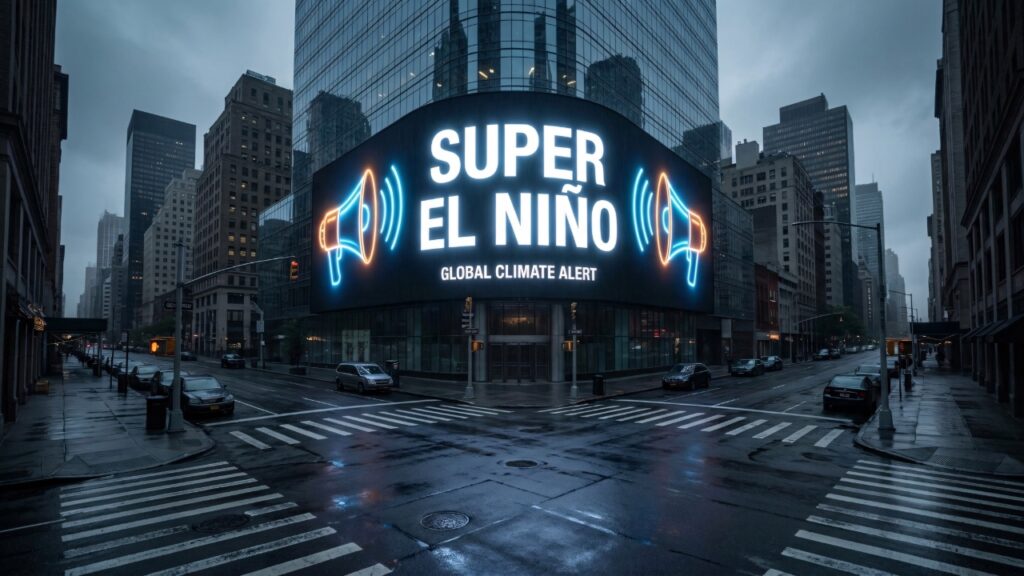
A Super El Niño is an exceptionally strong El Niño event, similar to those in 1982–83, 1997–98, and 2015–16. These events dramatically alter the jet stream over North America, often leading to major weather extremes across the United States. No two events are identical, but the general pattern is well understood.

🌧️ Southern U.S.: Wetter and Stormier
States including California, Arizona, New Mexico, Texas, Louisiana, Mississippi, Alabama, Georgia, and Florida often experience:
🌧️ Frequent rainstorms
🌊 Increased flood risk
🌪️ More severe thunderstorms
🌊 Coastal erosion from stronger winter storms
💧 Improved drought conditions in some areas
California may see repeated atmospheric rivers, bringing beneficial water supplies but also dangerous flooding, mudslides, and debris flows.
❄️ Northern U.S.: Warmer Than Average
The Pacific Northwest, northern Rockies, Upper Midwest, and northern Plains often experience:
🌡️ Milder winter temperatures
❄️ Less snow at lower elevations
🏔️ Reduced mountain snowpack in some regions
Earlier spring snowmelt
Cities like Seattle, Minneapolis, Chicago, and Detroit often see fewer Arctic outbreaks than normal.
🏔️ Rockies
Conditions vary depending on location:
Southern Rockies (Colorado, New Mexico) often receive abundant snowfall.
Northern Rockies (Montana, Idaho) may be warmer with below-average snow.
🌪️ Southeast
Florida and the Gulf Coast frequently experience:
Heavy winter rain
Strong thunderstorms
Occasional tornado outbreaks
Localized flash flooding
For Marco Island and Naples, a strong El Niño winter could mean:
🌧️ More rainy days
🌊 Rougher Gulf waters
🌬️ Stronger cold fronts
Fewer prolonged dry spells
Reduced wildfire danger
🌀 Atlantic Hurricanes
One major benefit of El Niño:
✅ Atlantic hurricane activity is usually reduced because stronger upper-level winds tear apart developing tropical systems.
This often means:
Fewer hurricanes
Fewer major hurricanes
Less activity in the Caribbean and Gulf of Mexico
🌊 Pacific Hurricanes
The opposite usually occurs in the eastern Pacific:
More tropical storms
More hurricanes
Longer hurricane season
Greater impacts for Mexico and sometimes Hawaii
🌡️ Global Effects
A Super El Niño can contribute to:
Record global temperatures
Coral bleaching
Drought in Australia and Indonesia
Flooding in parts of South America
Changes in Asian monsoon patterns
Could It Produce Historic U.S. Snowstorms?
Yes.
Although the northern U.S. is generally warmer, the southern storm track becomes much more active. When cold Arctic air meets abundant Pacific moisture, the result can be blockbuster snowstorms.
Examples include:
❄️ Major East Coast nor’easters
❄️ Heavy snow in the southern Appalachians
❄️ Significant snowfall in the Mid-Atlantic
❄️ Blizzard conditions across parts of the Plains and Rockies
Typical U.S. Super El Niño Winter Pattern
| Region | Typical Impact |
|---|---|
| California | Much wetter, flooding risk |
| Southwest | Wet and cooler |
| Texas & Gulf Coast | Wet, stormy |
| Florida | Cooler, wetter, severe storms |
| Southeast | Above-average rainfall |
| Northern Plains | Warmer, less snow |
| Great Lakes | Milder overall |
| Northeast | Variable, but increased potential for major coastal snowstorms if cold air is available |
| Pacific Northwest | Warmer and generally drier |
A true Super El Niño doesn’t guarantee these outcomes every time, but it significantly shifts the odds toward this pattern. It can produce some of the most memorable U.S. winter weather on record—from catastrophic California flooding to historic East Coast snowstorms, while simultaneously suppressing the Atlantic hurricane season.